Announcing the release of the Android app

Bomb Sight iconThe Bomb Sight Android app is now available to download for free through the Google Play store.

Get it on Google Play

The app gives you access to the interactive map of the aggregate bomb census, showing bombs that fell between 7th October 1940 and 6th June 1941.

If you’re in London, you can also explore the bomb locations using augmented reality technology, overlaying the bomb locations on top of the modern landscape around you. This provides an innovative way to explore information which was previously only accessible to researchers visiting the National Archives at Kew.

Screenshot of the mapScreenshot of the map view

Screenshot of the location on the original bomb censusScreenshot of the location on the original bomb census

Screenshot of the augmented reality viewScreenshot of the augmented reality view

If you notice any issues with the mobile app, please let us know by tweeting us @BombSightUK or emailing bombsight@geobits.co.uk. If you like the app, we’d love it if you could write a short review on the Play store.

Posted in technical | Leave a comment

Why did Bomb Sight go viral?

On Monday, the Bomb Sight team had a debrief and a very large cup of coffee each. We took the opportunity to discuss why we thought the project went viral with the help of different social media, our official press release had not gone out and we do not have anyone working PR. No one in the team has experienced this type of phenomena before. We asked JISC, our funders,  and the Press Office at the University of Portsmouth and they too had not had a project become an overnight interest to the media with such fervour. Do you know of any other small academic mapping projects that have gone viral?

When the project went live we quietly launched with just a few tweets to our followers and then on Wednesday 5th December the buzz around the project really picked up. I was contacted that evening by a Reuter’s journalist who I will be doing an interview for – he was the first journalist to contact me. I asked him today how he found out about the project and it was via Facebook. So perhaps people started to share links via the Addthis facility on the website?

So the question remains how did such a small project become such an internet phenomena (with more than 1.8 million page views)? We think there are a number of reasons ranging from both technical and human in nature.

TECHNICAL REASONS FOR BOMB SIGHT SUCCESS

A good interface that is both useful and usable interface

As academics myself and Patrick are interested in usability – how can you develop useful and usable mapping applications.  Good interfaces need to be easy to learn,  have functionality that is  easy to remember, does not take too long to complete tasks, has low error rate and finally the interface must leave the users feeling satisfied. We tried to follow some basic principles of usability engineering, using the following methods:

  • Developed user stories
  • Created wireframes
  • User testing the wireframes
  • Created a prototype
  • Extensive user testing using set tasks and think aloud techniques

The result, we believe, is an interface that is intuitive and easy to use by a wide variety of users – many who are unfamiliar with Geographical Information Science (GIS) as a discipline but are familiar with mapping applications such as Google Maps.

Cartographic impact 

We tried to design the interface to consider some basic rules of cartography  to engage the emotion, to create a visual hierarchy and to ensure simplicity.

The map is the most important feature of the interface.  We made it as large as possible so it takes priority.

We tried to make sure that at whatever zoom level the data had visual impact. We did struggle with the cartographic design of the smaller scale  – where the user is zoomed out to view all of London. The current visualisation we thought, as experts, looked a little messy but during user testing users said that sheer quantity of red dots had a powerful visual impact. So whilst this visual may look crowded it successfully engages an emotional response in the user.

bbc screenshotThe zoomed out image seems to be the one that has been most commonly used by the media when reporting on the project. It has created a considerable impact. Described by the BBC as the “Circle of Fire”

We actually originally had a clustering algorithm functioning on our prototype which as the user zoomed out to a smaller scale, the display would cluster the data together to create a graduated symbol map with larger circles showing greater counts of bombs.  Once we had digitally captured all the 31,000+ bombs for the region 5 area and integrated the point data into our interface, we soon realised that client side processing of the clustering algorithm would be unsustainable. This is because our users vary from academics, students, and citizen researchers. Thus we could not be sure our users have the latest high spec laptops that could process such a large dataset and people stop using the interface if it takes to long to carry out tasks. Therefore, we had to choose a more simple method of displaying the data – that could then be created into a tileset. This decision represented a choice between cartography (methods of generalisation) and usability engineering: ensuring users did not have to wait more than a second to zoom into the next cartographic layer.

Our use of colour – using the read circles to mark the location of falling bombs and the red icons when the user is zoomed in. Emphasises the visual impact of the display. Red is the colour our eye is drawn to first so by colouring the bombs red we ensure they are the most important piece of information on the map.  At some point we did have purple icons – but this is really less effective.

The design of our interface

When designing our interface we wanted a design that was serious and simple. That was neutral in styling and apolitical. It was important to us that the subject matter of the data would be presented in a way that was reverential to the horror of war.

HUMAN FACTORS FOR BOMB SIGHT BECOMING A VIRAL INTERNET PHENOMENON

Users were interested to look up locations that are significant to them and explore what happened at a particular point in history. Enabling people to enquire about their local neighbourhoods and engage with local history and explore how neighbourhoods have developed.

For certain generations the war is far enough away in time that it is difficult to imagine but close enough to be personally relevant and interesting .

Therefore the website is able to bring archives data into the present day – increasing accessibility to fascinating data and widening participation by bringing old data to life through the merger of geography, history and technology.

The inclusion of memories and photographs adds meaning to the points on the map – presenting an enriched view of a particular point in history. Therefore the combination of qualitative data with quantitative data combined together created a powerful view of local environments.

Do you have any thoughts on why the website went viral?

Posted in dissemination | Tagged , , , , , , | Leave a comment

On scaling from 40 visitors a day to 6 every second

When we launched the Bomb Sight website at the end of November, none of the project team had imagined quite how much interest there would be in the project.

We were pleased when we saw some people starting to tweet about it, and saw the number of visitors rise to 40 a day this time last week.

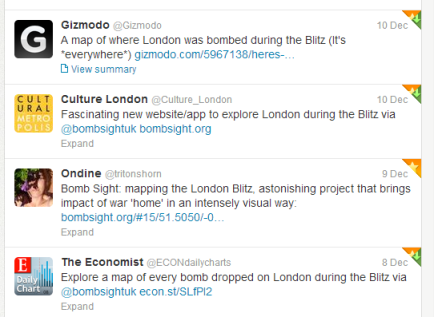
When I spotted at lunchtime on Wednesday that we were seeing an increasing level of traffic from Twitter, I sent a tongue-in-cheek email to the team saying I thought it might be starting to go viral. At that point we were seeing about one visitor a minute, and by the end of the day we were seeing about one every ten seconds, and had served 2,235 visitors over the course of the day. The web site was starting to feel a bit slow at times, but we think it was serving most visitors who tried to access the site.

A tweet from @qikipedia to their 357,000 followers suggests we were struggling by Thursday morning, but we kept serving visitors at about the same level of demand as we were on Wednesday… until 4pm on Thursday when we saw the first media article about the project.

That’s when we really realised that the server couldn’t keep up with the demand of 8,000 visitors an hour – and you would likely have been seeing errors quite often – so Patrick and I started to look at the server to see what we could do to help it scale with the resources we had available. I think we managed to squeeze a bit more capacity out of it, so some more people were able to view the site if they were lucky enough to get through. We definitely weren’t able to make it available to everyone who was trying to access the site though.

Thankfully we spotted a tweet that evening from CloudFlare, a company that specialises in delivering content faster and more reliably by sitting between the users accessing the site and the website itself. They shelter your server from intense levels of traffic by keeping a copy of your pages on their own servers and serving that out to users on your behalf.

Thursday evening was spent trying to get this set up and working, and by 1am we were seeing about 30 users a minute again. It wasn’t quite the 5 minute setup they advertise – as we waited for DNS changeovers, tried to get to grips with the configuration needed, competed with everyone else to access our own pages, and tried to keep our server online enough for CloudFlare to cache copies of the pages – but by the end of the night I was feeling a bit more comfortable that we’d be able to keep the website running a bit better for the next day. The front page of the site (the main map) was being cached by CloudFlare, and that was the most important part to keep working.

We had already served 18,459 visitors on Thursday, but that still wasn’t the busiest day we’d see. By far.

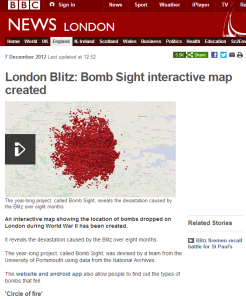
By Friday morning, Patrick noticed that CloudFlare had started serving out a 404 Not Found error message instead of the homepage, which we battled with for a while, but managed to get rid of in the end. At 11am we were serving about 40 visitors a minute, until the BBC published their article around noon and we hit 380 visitors a minute, or 6 a second. And probably quite a few error pages too, unfortunately, as we worked to get rid of the remaining ones.

Friday saw around 185,000 visitors coming to the site, which just would not have been possible if we didn’t have the support of CloudFlare to serve the vast majority of that traffic for us.

Up to this point on Tuesday, we have already had somewhere between 300,000 – 500,000 visitors* to the Bomb Sight website, and are currently serving about 900 visitors an hour. According to CloudFlare, these visitors have viewed upwards of 1.8 million pages between them.

We have shifted around 3 terabytes of data, of which CloudFlare has served about 2.7TB for us. 1.2TB of that were in the first 24 hours, and at the peak we were seeing a throughput of about 150GB an hour. That’s a lot of data, especially when it was wasn’t planned for in advance.

The moral of the story – if you think there’s even the slightest possibility your project may go viral, plan in advance to add in a service such as CloudFlare to take some of the traffic away from your servers and give you some breathing space. Especially considering it’s free to use their service!

As we posted on Thursday, we’re sorry if you’ve had troubles accessing the site so far, but we hope that you were eventually able to access the site, and will be able to explore it further now that we’re better equipped.

We are noticing from the statistics that people are starting to come back and explore the site more – with almost 25% of visitors today being people who have viewed the site more than once – which is a good sign that the data is of value and interest to people who want to learn more about the history London. We’re also starting to see more people finding the site from Google searches about the Blitz, and about particular parts of London.

* it’s difficult to accurately measure the number of visitors to the site, partly because some users will have seen error messages, others may not have been counted if they viewed the site embedded in a media article, and different services give statistics calculated in different ways. The visitor statistics in this post are all from Google Analytics while the data statistics are from CloudFlare.

Posted in dissemination, technical | Tagged , , , , , , | 3 Comments

A huge thank you

This week, the level of public engagement with the project and intensity of media interest knocked us off our feet. It was totally unexpected but there are some people who I owe a big thank you to:

Firstly to the team: 

Dan, Your efforts to keep us running on this week when Patrick was not available were incredible and beyond what is expected. It has been truly appreciated and I have a bottle of Champagne for you (which does not seem enough). looking forward to the mobile app.

Patrick – you built the website off an idea – Thanks for making it something tangible and useful.

Jasia – Your design ensured we have a usable and engaging website. This has certainly contributed to the level of public engagement we have been experiencing.

CloudFlare staff:

Justin, John  – what luck that you got in touch. The services of Cloudflare have enabled us to keep running the website whilst the level of public interest has been so high.

University of Portsmouth staff:

Kate – Thanks for all you support as press officer – I have been a bit like a deer in headlights and hopefully have managed to do the university proud.

Matt and Martin – thanks for quickly providing us with 2 more CPU’s for the server. It seems to have made a big difference

JISC staff:

Rebecca  and Paola – thanks for help with the official press release even though Twitter beat us to it.

JISC Panel – those who decided to fund the project – Thank you very much for seeing its potential.

The National Archives staff:

Laura, Andrew and Rose – Thanks for your support with the project. Sorry the TNA have been inundated with requests. I hope the coverage has been good for you.

The journalists and media outlets:

So many to thank both in this country and around the world. Thanks for seeing the potential in the project.

and last but not least to our users: 

The level of interest is phenomenal – many of you have been very patient and understanding with respect to accessing the website due to the volume of interest. Thanks. We hope you have found the web site useful – it has been designed as a tool for educational use to aid understanding about their local environment and how it has developed.

Posted in Uncategorized | 4 Comments

Still experiencing server issues

I realise this may be frustrating that you may not be able to access the website. We are doing our best but the sheer volume of users is placing exceptional demand on our server. The project is a small academic project and were were not expecting the level of interest that has been shown in the project.

I would like to thank everyone who has shown an interest in the project and assure you that we are really trying are best with the resources available. Please try again later.

The Bomb Sight Team.

Posted in Uncategorized | 11 Comments

Scale of interest and server issues

If you have had problems accessing the website or it is running very slowly – The sheer scale of public and media interest has had an impact on our server. We are doing our best to explore the issues but we are a very small team and it takes some time resolve the issues. This is my first research funded project and we are constantly learning.

I will post an update tomorrow but in the mean time if you want to have a look at our video about the website and the forthcoming app as it was in development check out this link.

https://blitzbombcensusmaps.wordpress.com/2012/11/06/progress-update-and-preview-of-the-website-and-mobile-app/

Thanks for you interest in the project.

Kate and the Bomb Sight Team.


Posted in Uncategorized | 12 Comments

Bomb Sight is Live

logoStart discovering London’s wartime past today on our website ( and  our mobile app which is coming very soon). The Bomb Sight project is mapping the London WW2 bomb census between 7/10/1940 and 06/06/1941. Previously available only by viewing in the Reading Room at The National Archives, Bomb Sight is making the maps available to citizen researchers, academics and students wanting to explore where the bombs fell and to discover memories and photographs from the period.

We have combined the location of each of the falling bombs over an 8 month period of the London Blitz together with geo-located photographs from the Imperial War Museum and Geo-located Memories from the BBC WW2 People’s war archive. Clustering together lots of different data using the power of geography. In time the data will be made available under a creative commons licence and has the potential to be used in lots of different types of teaching and learning activities.

http://bombsight.org/

Please note that the website has been built to be compatible with the latest browser software – so if you access it with old versions of Internet Explorer (IE 7 for example) we suggesting upgrading your browser software.

Posted in dissemination | Tagged , , , , , , , , | 45 Comments

Building the Android mobile prototype app for Bomb Sight

Since my last blog post giving a technical overview, the Android app has come along nicely and the second prototype is now being developed further into what will become the version of the app we release.

Development of the prototype continued using the Phonegap framework – allowing for possible future porting to the iPhone – and is using the Javascript-based Leaflet mapping library for the map view rather than the Android-specific library we had used in the initial prototype.

A quick walkthrough

When you load the current version of the app, you are shown a quick introduction and then invited to view the map when you are ready. The map is showing the data from approximately the first 8 months of the Blitz (October 1940 to June 1941), including the type of bomb that fell at each location.

If you are in the London area then the map will zoom in to your current location and highlight it with a marker in amongst the bomb markers. If you’re not in London (or if we can’t locate you) the map will zoom to a view of Greater London which gives you an impression of the vast number of bombs that fell during that period. If you’ve moved the map around, you can always zoom back to your current location using the crosshair icon underneath the zoom controls.

Map view with small icons

When you’re zoomed in to a small area, we show you a map with markers that depict the type of bomb that fell at each location. If you’re zoomed further out then we simplify the icons so they don’t just end up covering the street layout on the map.

Map view with larger icons

The augmented reality view shows you markers hovering over where bombs fell, scaled to show closer locations with larger markers and smaller ones for those further away. For some more contextual information, where we can, we add a label with the name of the street it fell on. If you click on the marker, you’ll get a bit more information about the bomb and how far away from your location it fell. The associated radar dot will also be highlighted so you can see where it is in relation to others showing on the display.

Augmented Reality view

Prototyping and iterative improvements

As I’ve been building the prototype I’ve been regularly testing it out, including taking it out around the streets around where I live. Along with helping me find out more about the area I live in. Also the user testing At The National Archives  in October raised a number of questions and possible issues with the app…which we are now looking at.

Because we are currently relying on getting data from the project website rather than shipping it all with the app, the app can sometimes take a little while to load the data, and it will be using up your data allowance as well. In the coming weeks we’ll be looking to reduce the amount of data transfer required by stripping out information we don’t need, and possibly by shipping some of the data with the app so it doesn’t need to be transferred over the phone network once you’ve downloaded it from the app store.

There are currently issues with performance of the map when we’re showing a lot of information on the map, so we will be working to make this a bit easier for the phone to handle by simplifying how the data is displayed and not displaying any more information than is needed.

With the augmented reality view, we started off showing a simple icon for each bomb with a label underneath to show how far away it fell from where the user is currently standing. From testing this out and about on the street, it was clear that this didn’t give a very good experience as it wasn’t easy to tell where the markers referred to. This is how we came to changing icon sizes and trialling address labels to help users contextualise what they are seeing.

When there are lots of bombs that fell in a certain area, the screen can become quite full, so we will be trying a number of techniques to try and help the situation out here. The screenshot below shows a trial of slightly translucent markers to let users see markers in the distance as well as the closest ones, but it may be that it adds more detail to the screen than is necessary. What do you think? Do the address labels add to the confusion too?

Lots of markers

On the subject of augmented reality, when you’re trying to overlay information in an exact location, you need to make sure you know exactly where the user is, and which way their phone is pointing. This can be a bit problematic at times if your location hasn’t been detected accurately (e.g. if you’re under trees, near tall buildings or away from wifi networks), and may mean that what you’re seeing on the display doesn’t actually reflect reality. Over time as your phone refines its location, the display will update to correct this, but it may still lead to some confusion initially.

I will try to mitigate some of these issues in the final app by checking location accuracy (and currency, if you’ve walked on a bit since your phone last detected your location) before showing the first display of data, and perhaps try showing a small map of what we believe the user’s location to be.

I’ll post again when the app is available for wider testing, but why not tweet us @BombSightUK if you’d like to be an early tester.

Posted in project details, User-Centred Design | Tagged , , , , | 8 Comments

Progress update and preview of the website and mobile App

The last few weeks have seen considerable progress on the project. Amongst the many tasks that we have been working on we have selected a project name (see blog post: finding an application name), we have finished processing all of the maps and have them imported into Geoserver, we have complete the digital capture of bomb location from both the weekly maps and aggregate map sheets and we are developing our brand identity and communication plan.

We have been working diligently on the development of the web and mobile app. Progress is going well and we are planning our second  round of user testing at The National Archives this Friday Nov 9th  between 12 and 4pm. Our first round of testing two Staurday’s ago was positive and we identified some issues that have been resolved (I will write a separate blog post discussing the user testing).

Currently the apps are without their stylish front-end as this is currently being designed and implemented. What we will be testing is the functionality and meaning of the buttons and text as well as evaluating how intuitive the tools are to use.  We have also designed a set of icons for the different data we are clustering together and we will evaluate if their inherent meaning can be understood.

For a sneak preview of the apps we have created a short video – I used the freely available Microsoft Movie Maker together with lot of screen shots, that I linked together using transitions. For the music I browsed the open source catalogue available via Jamendo. This is my first attempt at creating a video, so it is not too long but hopefully gives you a taste of what we are developing.

I have embedded the video in this blog post, but the project has also set up a You Tube channel where we will be posting more updates and project information. The channel is called BombSightUK.


Posted in project plan, User-Centred Design | Tagged , , , , , , | 13 Comments

Announcing Bomb Sight

Watch this space….Coming Soon

http://bombsight.org/

https://twitter.com/BombSightUK

Posted in dissemination | Tagged , , , | Leave a comment